能够生成分析和调试信息是我喜欢Go语言的原因之一。通过配置GODEBUG环境变量可以在程序运行期间打印出调试信息,包括gc和scheduler的详细或摘要。最棒的是你不必在程序里设置任何开关它就能够正常工作。
开始前
在这篇文章中,我将向您展示如何使用示例并发Go程序中解释调度程序跟踪信息。 如果您对调度程序有基本的了解,这将有所帮助。 我建议在继续之前阅读这两篇文章:
Concurrency, Goroutines and GOMAXPROCS Go Scheduler
代码
以下是我们检查和解释GODEBUG结果的示例程序。
List1
1
2
3
4
5
6
7
8
9
10
11
12
13
14
15
16
17
18
19
20
21
22
23
24
25
26
27
package mainimport ( "sync" "time" ) func main () workNum := 10 var wg sync.WaitGroup wg.Add(workNum) for i := 0 ; i < workNum; i++ { go work(&wg) } wg.Wait() time.Sleep(3 * time.Second) } func work (wg *sync.WaitGroup) time.Sleep(time.Second * 1 ) var counter int for i := 0 ; i < 1e10 ; i++ { counter++ } wg.Done() }
List1中的代码旨在针对我们希望运行时发出的调试信息进行预测。 在第12行,声明一个for循环创建十个goroutines。 然后主函数在第16行等待所有goroutines完成他们的工作。 第22行的工作函数休眠一秒钟,然后将局部变量增加100亿次。 递增完成后,该函数在等待组上调用Done并返回。
在设置GODEBUG来运行程序之前首先构建程序是一个不错的主意,该变量由运行时被设置,因此应用go命令也会产生跟踪输出。如果你使用go run来跟踪程序,那么在程序正式运行之前构建时的追踪信息也将被打印出来。
分析
下边让我们来运行这个程序:
追踪scheduler摘要信息
通过schedtrace 配置项可以让程序在运行时每隔 X 毫秒打印一行包括调度器状态和标准错误的摘要信息。让我们设置GODEBUG选项并运行这个程序吧:
1 GOMAXPROCS=1 GODEBUG=schedtrace=1000 ./example
一旦程序开始运行,我们就可以看到追踪(tracing)信息开始打印了。程序本身不输出任何内容,因此控制台输出的内容均为追踪信息,让我们看看前两次tracing信息。
1
2
3
SCHED 0ms: gomaxprocs=1 idleprocs=0 threads=2 spinningthreads=0 idlethreads=0 runqueue=0 [1] SCHED 1009ms: gomaxprocs=1 idleprocs=0 threads=3 spinningthreads=0 idlethreads=1 runqueue=0 [9]
让我们来分解一下每个字段的含义,并根据示例程序理解这些值的含义:
1
2
3
4
5
6
7
8
9
10
11
12
13
14
15
16
17
18
19
20
21
22
23
24
25
1009ms : 从程序开始到打印该行信息经过的毫秒数. 此处是第1秒时打印的trace. gomaxprocs=1 : 配置的P数量(注:需了解 goroutine调度模型中 M P G 概念). 在此次试验中,仅设置为1. 特别注意: 考虑在这里的processor是一个逻辑processor,而不是物理processor。 调度器在这些逻辑processors运行程序,而它们都是通过操作系统与内核线程(os thread)绑定的。 操作系统会在可用的物理processor上再次调度这些内核线程。 threads=3 : 运行时的线程数(注:我理解为goroutine调度模型中的M). 存在3个,一个用于processor,其他两个用于运行时 idlethreads=1 : 空闲线程的数量. 1个线程空闲,2个在运行. idleprocs=0 : 空闲processor的数量. 0个空闲,1个运行. runqueue=0 : 全局运行队列(runq)中goroutine的数量. 所有可运行的goroutine被移动到 P 的local运行队列(注:p.runq). [9] : P 的local 运行队列中的 goroutine 数量(注:由于运行时配置了processor数量为1这里只打印1个,配置多个时会打印多个,对应每一个 P). 在P的local 运行队列中有 9个goroutine.
程序在运行时给了我们很多非常棒的摘要信息。当我们在查看第一秒打印的追踪信息时,我们可以看到一个goroutine是如何运行而其他9个goroutine在 P的local 运行队列中等待。
示例图1
在示例图1中,用字母 P 来表示processor,用字母 M 来表示线程,用字母 G 来表示goroutine。我们可以根据 runqueue 的值为0而推断出全局的运行队列(Global Run Queue)是空的。prcessor 的 idleprocs 值为0,而它正在运行着一个 goroutine ,我们后边新建的goroutine则在这个 processor的local 运行队列中(根据process 的runqueue值为9判断的)。
当我们把processor个数配置多个时会有怎样的追踪信息呢?让我们把GOMAXPROCS的值设置为2,再看一次:
1
2
3
4
5
6
7
8
9
10
11
12
13
14
15
16
17
18
19
20
21
22
23
24
25
26
27
28
29
30
31
32
33
34
GOMAXPROCS=2 GODEBUG=schedtrace=1000 ./example SCHED 0ms: gomaxprocs=2 idleprocs=1 threads=2 spinningthreads=0 idlethreads=0 runqueue=0 [0 0] SCHED 1002ms: gomaxprocs=2 idleprocs=0 threads=4 spinningthreads=1 idlethreads=1 runqueue=0 [0 4] SCHED 2006ms: gomaxprocs=2 idleprocs=0 threads=4 spinningthreads=0 idlethreads=1 runqueue=0 [4 4] … SCHED 6024ms: gomaxprocs=2 idleprocs=0 threads=4 spinningthreads=0 idlethreads=1 runqueue=2 [3 3] … SCHED 10049ms: gomaxprocs=2 idleprocs=0 threads=4 spinningthreads=0 idlethreads=1 runqueue=4 [2 2] … SCHED 13067ms: gomaxprocs=2 idleprocs=0 threads=4 spinningthreads=0 idlethreads=1 runqueue=6 [1 1] … SCHED 17084ms: gomaxprocs=2 idleprocs=0 threads=4 spinningthreads=0 idlethreads=1 runqueue=8 [0 0] … SCHED 21100ms: gomaxprocs=2 idleprocs=2 threads=4 spinningthreads=0 idlethreads=2 runqueue=0 [0 0]
运行新程序后,让我们着重看一下第二秒之后的信息:
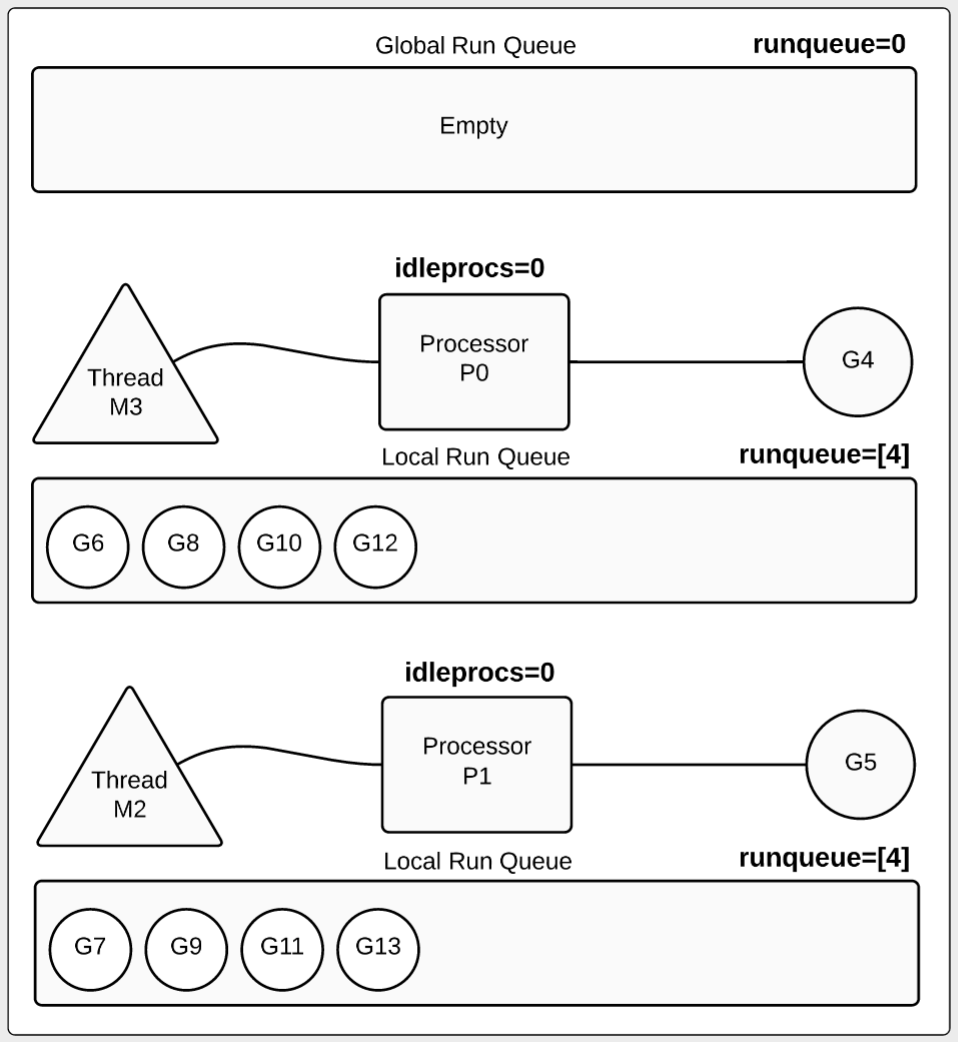
1
2
3
4
5
6
7
8
9
SCHED 2002ms: gomaxprocs=2 idleprocs=0 threads=4 spinningthreads=0 idlethreads=1 runqueue=0 [4 4] 2002ms : 标志这是第二秒追踪的信息. gomaxprocs=2 : 程序最大processor数是2. threads=4 : 4个线程,2个用于运行processor,2个用于运行时. idlethreads=1 : 1个空闲线程(3 threads running). idleprocs=0 : 0个空闲processor (2 processors busy). runqueue=0 : 所有可运行的goroutine被移动到 P的local运行队列(所以全局runqueue为0). [4 4] : 每个P的local 运行队列有4个 goroutine等待运行.
示例图2
让我们再看一下示例图2.我们能够看到goroutine是如何在两个 processor上运行的,其中有8个goroutine在runqueue中等待运行,它们分别在两个processor 的local 运行队列中(各4个)。
第6秒的时候,发生了一些变化
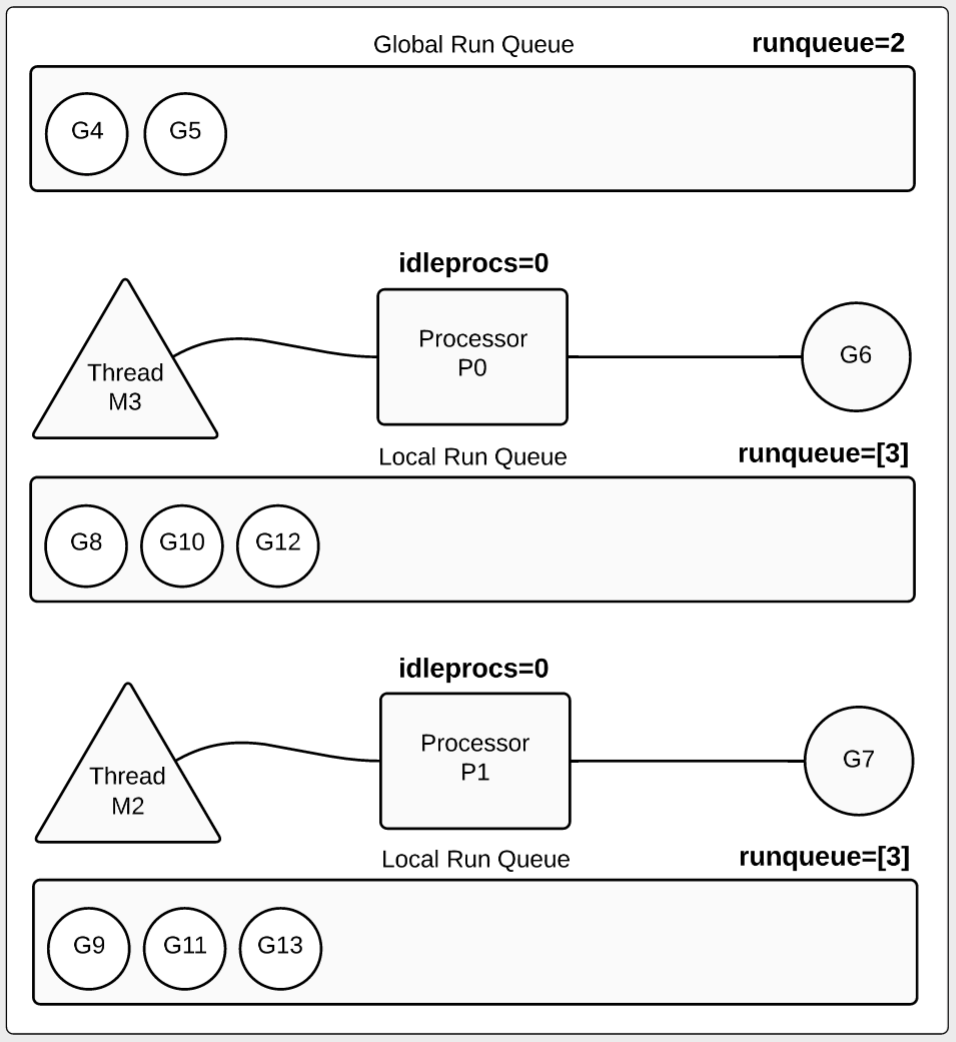
1
2
3
4
5
SCHED 6024ms: gomaxprocs=2 idleprocs=0 threads=4 spinningthreads=0 idlethreads=1 runqueue=2 [3 3] idleprocs=0 : 0 processors are idle (2 processors busy). runqueue=2 : 2 goroutines returned and are waiting to be terminated. [3 3] : 3 goroutines are waiting inside each local run queue.
示例图3
在此图中,我们创建的goroutine在完成工作之后被移动到 Golbal Run Queue 中。我们可以看到仍然有2个goroutine正在运行,每个processor各运行一个,每个processor的local 运行队列中有3个goroutine.
特别注意:
在许多情况下,goroutine在终止之前不会移回全局运行队列。 这个程序创建了一个特殊情况,因为for循环执行的逻辑运行时间超过10毫秒并且没有调用任何函数。 10ms是调度程序中的调度量。 执行10ms后,调度程序尝试抢占goroutines。 这些goroutine不能被抢占,因为它们不会调用任何函数。 在这种情况下,一旦goroutine到达wg.Done调用,goroutines立即被抢占并移动到全局运行队列以终止。
17秒的时候,我们可以看到在processor中正在运行着最后的两个goroutine。
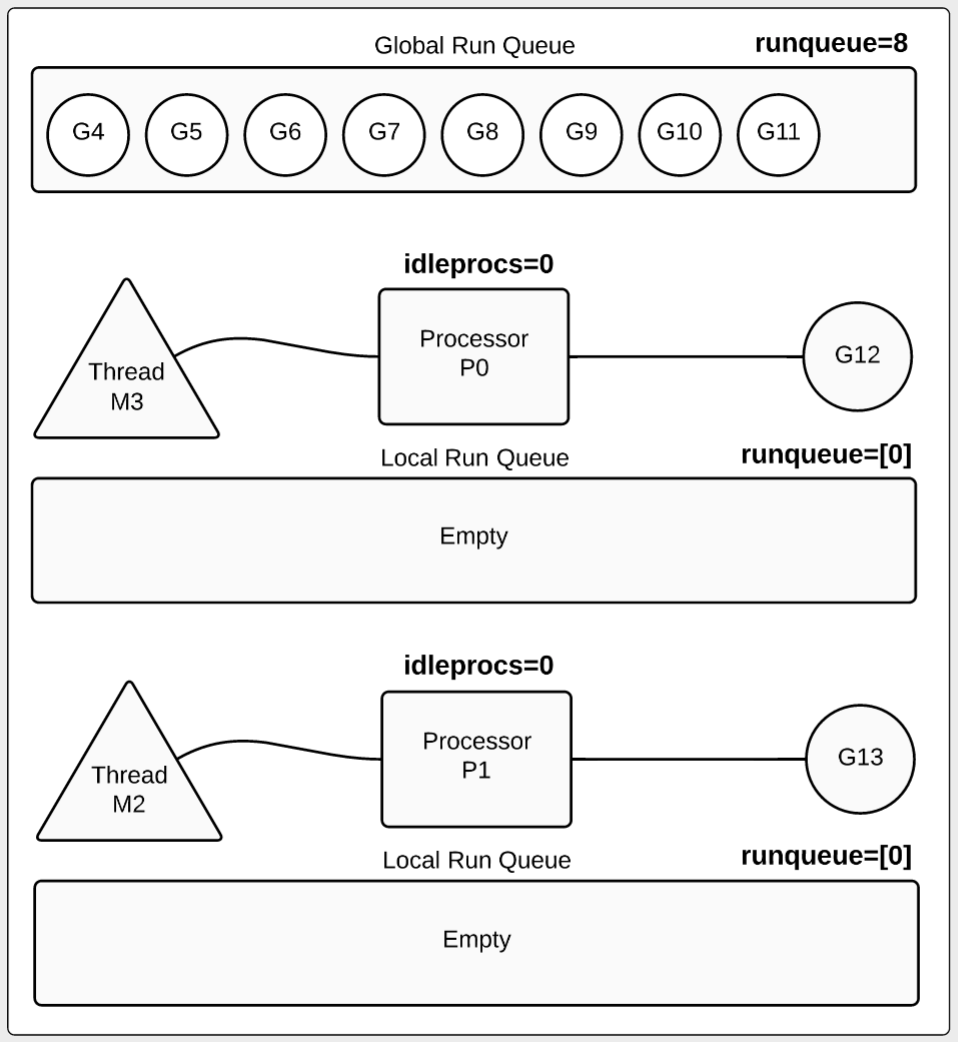
1
2
3
4
5
SCHED 17084ms: gomaxprocs=2 idleprocs=0 threads=4 spinningthreads=0 idlethreads=1 runqueue=8 [0 0] idleprocs=0 : 0 processors are idle (2 processors busy). runqueue=8 : 8 goroutines returned and are waiting to be terminated. [0 0] : No goroutines are waiting inside any local run queue.
示例图4
在图4中,我们看到8个goroutine在全局运行队列中,剩下的最后2个goroutine正在运行。 这时每个processor的local 运行队列都为空。
第21秒的摘要信息:
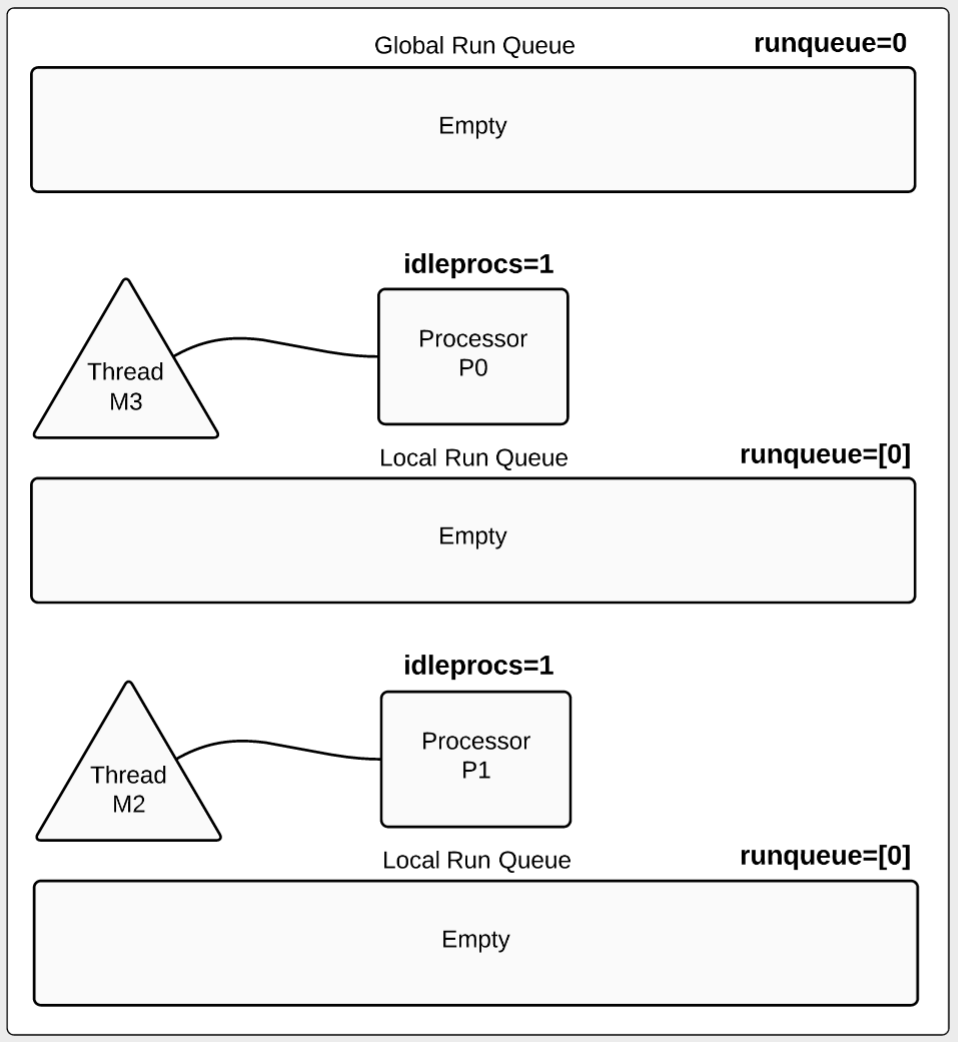
1
2
3
4
5
SCHED 21100ms: gomaxprocs=2 idleprocs=2 threads=4 spinningthreads=0 idlethreads=2 runqueue=0 [0 0] idleprocs=2 : 2 processors are idle (0 processors busy). runqueue=0 : All the goroutines that were in the queue have been terminated. [0 0] : No goroutines are waiting inside any local run queue.
示例图5
此时,所有的goroutine都完成工作,并且被终结。
追踪详细信息
scheduler的摘要追踪信息非常有用,但是有时你需要更详细的信息。在这种情况下,我们可以增加shceddetail配置,它能够提供 thread、processor、goroutine的详细信息,让我们重新运行程序:
1 GOMAXPROCS=2 GODEBUG=schedtrace=1000,scheddetail=1 ./example
以下是第4秒的输出:
1
2
3
4
5
6
7
8
9
10
11
12
13
14
15
16
17
18
19
20
21
22
SCHED 4028ms: gomaxprocs=2 idleprocs=0 threads=4 spinningthreads=0 idlethreads=1 runqueue=2 gcwaiting=0 nmidlelocked=0 stopwait=0 sysmonwait=0 P0: status=1 schedtick=10 syscalltick=0 m=3 runqsize=3 gfreecnt=0 P1: status=1 schedtick=10 syscalltick=1 m=2 runqsize=3 gfreecnt=0 M3: p=0 curg=4 mallocing=0 throwing=0 gcing=0 locks=0 dying=0 helpgc=0 spinning=0 blocked=0 lockedg=-1 M2: p=1 curg=10 mallocing=0 throwing=0 gcing=0 locks=0 dying=0 helpgc=0 spinning=0 blocked=0 lockedg=-1 M1: p=-1 curg=-1 mallocing=0 throwing=0 gcing=0 locks=1 dying=0 helpgc=0 spinning=0 blocked=0 lockedg=-1 M0: p=-1 curg=-1 mallocing=0 throwing=0 gcing=0 locks=0 dying=0 helpgc=0 spinning=0 blocked=0 lockedg=-1 G1: status=4(semacquire) m=-1 lockedm=-1 G2: status=4(force gc (idle)) m=-1 lockedm=-1 G3: status=4(GC sweep wait) m=-1 lockedm=-1 G4: status=2(sleep) m=3 lockedm=-1 G5: status=1(sleep) m=-1 lockedm=-1 G6: status=1(stack growth) m=-1 lockedm=-1 G7: status=1(sleep) m=-1 lockedm=-1 G8: status=1(sleep) m=-1 lockedm=-1 G9: status=1(stack growth) m=-1 lockedm=-1 G10: status=2(sleep) m=2 lockedm=-1 G11: status=1(sleep) m=-1 lockedm=-1 G12: status=1(sleep) m=-1 lockedm=-1 G13: status=1(sleep) m=-1 lockedm=-1 G17: status=4(timer goroutine (idle)) m=-1 lockedm=-1
摘要的部分与前边的实验输出是相似的,但是我们现在有更详细的 thread、processor、goroutine信息。从 processor开始看吧:
1
2
3
P0: status=1 schedtick=10 syscalltick=0 m=3 runqsize=3 gfreecnt=0 P1: status=1 schedtick=10 syscalltick=1 m=2 runqsize=3 gfreecnt=0
仍然用字母 P 表示 processor,由于GOMAXPROCS被设置为2,我们可以看到有两条关于P的信息。接下来我们看下线程:
1
2
3
4
5
6
7
8
9
10
11
M3: p=0 curg=4 mallocing=0 throwing=0 gcing=0 locks=0 dying=0 helpgc=0 spinning=0 blocked=0 lockedg=-1 M2: p=1 curg=10 mallocing=0 throwing=0 gcing=0 locks=0 dying=0 helpgc=0 spinning=0 blocked=0 lockedg=-1 M1: p=-1 curg=-1 mallocing=0 throwing=0 gcing=0 locks=1 dying=0 helpgc=0 spinning=0 blocked=0 lockedg=-1 M0: p=-1 curg=-1 mallocing=0 throwing=0 gcing=0 locks=0 dying=0 helpgc=0 spinning=0 blocked=0 lockedg=-1
M 表示线程。由于线程数被设置为4(注:并没看到那个地方配置了这个。。。),我们可以看到4条关于M的详细信息。从这些详细信息中可以看出哪个P与哪个M关联。
1
2
3
4
5
#在P的详情里P0的 m 值为3,表示P0与M3关联 P0: status=1 schedtick=10 syscalltick=0 m=3 runqsize=3 gfreecnt=0 # 反过来看M3,它的p值为0 M3: p=0 curg=4 mallocing=0 throwing=0 gcing=0 locks=0 dying=0 helpgc=0 spinning=0 blocked=0 lockedg=-1
这里看到了M3和P0关联到一起,P 和 M都会记录这个信息。
G表示一个goroutine。在4秒标记处,我们看到目前存在14个goroutine,自程序启动以来已创建了17个goroutine。 我们知道由于跟踪中列出的最后一个G附加的数字而创建的goroutine总数:
1 G17: status=4(timer goroutine (idle)) m=-1 lockedm=-1
如果这个程序继续创建goroutines,我们会看到这个数字线性增加。 例如,如果该程序正在处理Web请求,我们可以使用这个数值来大致了解已处理的请求数。 如果程序在处理请求期间没有创建任何其他goroutine,则此估计值更接近真实的请求数。
接下来再看一下 main函数运行的 goroutine:
1
2
3
G1: status=4(semacquire) m=-1 lockedm=-1 30 wg.Done()
我们可以看到,main函数所在的 goroutine状态是 4,阻塞在 semacquire,这是因为我们在代码中调用了 group.Wait。
为了更好地理解此跟踪中的其余goroutine,了解状态数字代表什么是有很有用的。 以下是在运行时头文件中声明的状态代码列表:
1
2
3
4
5
6
7
8
9
10
status: http://golang.org/src/runtime/ Gidle, // 0 Grunnable, // 1 runnable and on a run queue Grunning, // 2 running Gsyscall, // 3 performing a syscall Gwaiting, // 4 waiting for the runtime Gmoribund_unused, // 5 currently unused, but hardcoded in gdb scripts Gdead, // 6 goroutine is dead Genqueue, // 7 only the Gscanenqueue is used Gcopystack, // 8 in this state when newstack is moving the stack
当我们查看我们创建的10个goroutines时,我们现在可以查看它们的状态并更好地了解每个goroutine正在做什么:
1
2
3
4
5
6
7
8
9
10
11
12
13
14
15
16
17
// Goroutines running in a processor. (idleprocs=0) G4: status=2(sleep) m=3 lockedm=-1 – Thread M3 / Processor P0 G10: status=2(sleep) m=2 lockedm=-1 – Thread M2 / Processor P1 // Goroutines waiting to be run on a particular processor. (runqsize=3) G5: status=1(sleep) m=-1 lockedm=-1 G7: status=1(sleep) m=-1 lockedm=-1 G8: status=1(sleep) m=-1 lockedm=-1 // Goroutines waiting to be run on a particular processor. (runqsize=3) G11: status=1(sleep) m=-1 lockedm=-1 G12: status=1(sleep) m=-1 lockedm=-1 G13: status=1(sleep) m=-1 lockedm=-1 // Goroutines waiting on the global run queue. (runqueue=2) G6: status=1(stack growth) m=-1 lockedm=-1 G9: status=1(stack growth) m=-1 lockedm=-1
通过对调度程序的基本了解以及了解程序的行为,我们可以详细了解事情的调度方式以及程序中每个处理器,线程和goroutine的状态。
结论
GODEBUG是在程序运行时窥视调度程序思维的好方法。 它可以告诉你很多关于程序的行为方式。 如果您想了解更多信息,请首先编写一些可用于预测来自调度程序的跟踪的简单程序。 在尝试查看更复杂程序的跟踪之前,了解期望的内容。
原文地址